Understanding how signals evolve helps you interpret marketing performance more realistically.
This knowledge allows you to avoid reacting too early, recognise meaningful progress sooner, and make better-timed growth decisions.
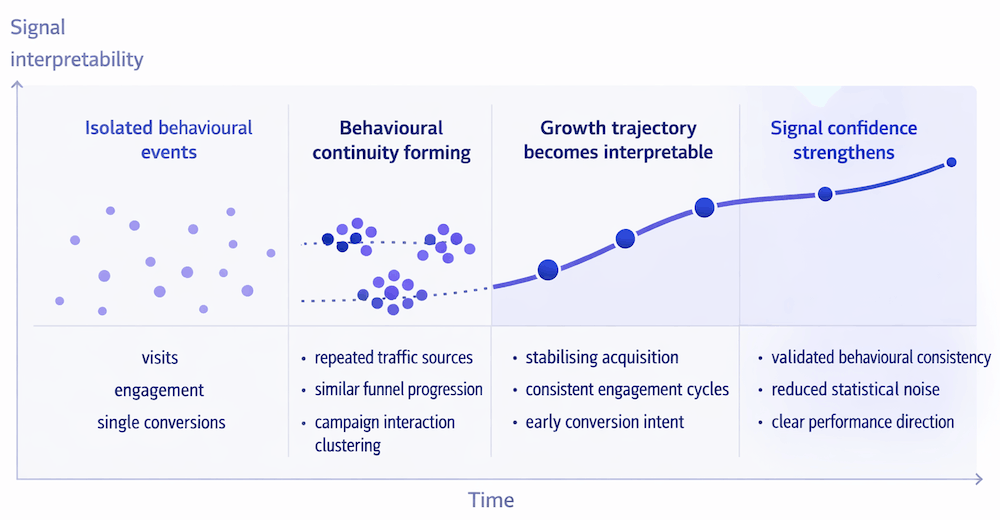
From Isolated Events To Observable Tendencies
At the earliest stage of any marketing activity, performance data usually appears scattered.
You may see a few visits from different sources, occasional engagement actions, or a single conversion event.
On their own, these events rarely indicate meaningful progress. However, when similar behaviours begin to repeat under comparable conditions, they start forming observable tendencies.
For example:
- traffic repeatedly arriving from a specific creator or channel
- users consistently reaching the same funnel stage
- engagement actions clustering around certain campaigns
- conversion attempts appearing in related time windows
Growth signals begin when individual data points transform into behavioural continuity.
In other words, the shift from dots to lines is the first moment where growth becomes interpretable.
From Snapshots To Growth Patterns
Traditional dashboards often present performance as static snapshots.
Metrics are shown as isolated numbers tied to specific dates or reporting periods.
While useful for measurement, snapshots alone rarely reveal how growth is actually developing.
Growth patterns emerge when you observe sequences rather than moments.
Instead of asking:
- “What happened today?”
A growth-oriented mindset asks:
- “What direction is performance moving toward?”
Patterns may include:
- gradually improving funnel progression
- stabilising acquisition sources
- increasing behavioural consistency
- repeated engagement cycles
These developments are often invisible in single-period metrics, yet they strongly influence future outcomes.
Learning to recognise patterns requires stepping back from individual data points and focusing on movement over time.
Confidence Builds With Time And Activity
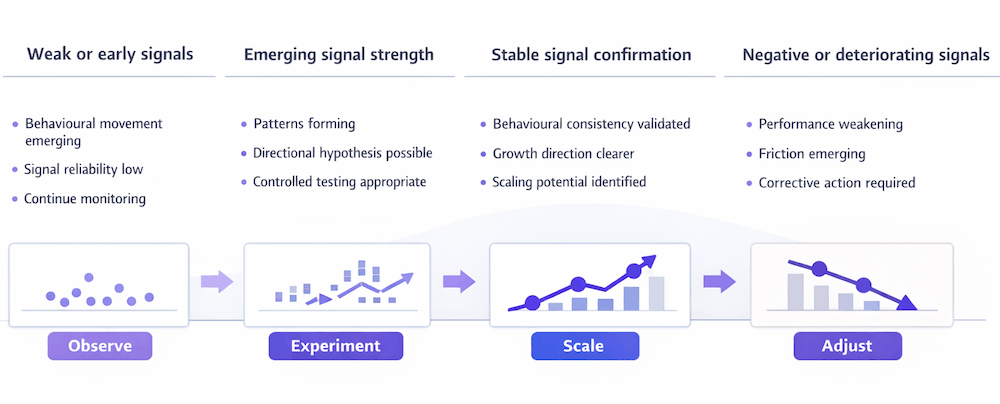
Growth signals are rarely binary. They do not appear suddenly as “true” or “false”. Instead, signal clarity increases progressively as more activity accumulates.
Confidence grows through two structural mechanisms:
1. Time exposure: Signals observed across multiple periods become more reliable than those detected in a single spike.
2. Interaction density: Higher volumes of meaningful user actions accelerate signal formation by reducing statistical noise.
For example:
- ten conversions spread across unrelated sources may produce less confidence than
- five conversions consistently tied to the same acquisition path
Confidence is therefore not emotional intuition.
It is the result of repeated behavioural validation.
Understanding this helps teams avoid premature scaling decisions or unnecessary campaign interruptions.
Signals Often Appear Before Results
One of the most important realities of growth dynamics is that performance outcomes usually lag behind behavioural change.
In many cases:
- user interest stabilises before revenue increases
- funnel progression improves before conversion rates rise
- engagement depth strengthens before customer lifetime value becomes visible
These early developments act as predictive indicators rather than confirmed success metrics.
Teams that learn to detect such signals can respond earlier to emerging opportunities or risks.
Conversely, waiting only for final KPIs may delay important strategic adjustments.
Recognising signals before results allows growth management to become more proactive rather than reactive.
Why Longer Observation Improves Insight Quality
Marketing performance is inherently volatile in the short term.
Daily fluctuations may reflect temporary campaign exposure, algorithmic changes, or random behavioural variation. Longer observation periods help filter out this noise.
Over extended timelines:
- meaningful trends become easier to distinguish
- experimental outcomes can be compared more fairly
- seasonal or cyclical effects become visible
- signal stability can be validated
Growth therefore develops in phases, not isolated moments.
Each phase contributes additional context, allowing performance interpretation to become progressively clearer.
Teams that adopt longer observation horizons are better equipped to understand structural growth dynamics rather than reacting to temporary spikes or dips.
Limits Of Early Signal Interpretation
Although early signals are valuable, they also carry limitations.
At initial stages:
- small datasets increase uncertainty
- directional movement may be mistaken for sustainable growth
- isolated performance bursts may distort perception
- decision timing becomes more sensitive
Early data should therefore be treated as directional guidance, not absolute proof.
This means:
- exploring promising opportunities cautiously
- continuing to validate emerging patterns
- avoiding irreversible commitments based on limited evidence
Effective growth management requires balancing curiosity with discipline.
Why Systematic Signal Detection Matters
Interpreting growth signals manually becomes increasingly complex as marketing environments expand.
Multiple channels, campaigns, creators, and user journeys interact simultaneously.
Patterns that appear clear in isolation may become difficult to evaluate across a broader performance landscape.
Structured signal detection frameworks help reduce this cognitive burden by:
- consolidating behavioural trends across sources
- contextualising performance movement over time
- supporting more consistent decision timing
- improving confidence in directional judgement
In next chapters, you will learn how OneLence operationalises these principles by transforming evolving signals into structured insights and practical decision guidance.